Ion ANGHEL, Raluca Roxana PURNICHESCU PURTAN, Andreea UDREA
The goal of the paper is to develop methods and algorithms based on thechaotic dynamical systems theory (fractal dimension analysis) and specific nonparametric statistics methods (bootstrap and bias-corrected and accelerated percentile intervals) and to apply them to study CT images of sinus tumors. The statistical analysis shows that the use of the fractal dimension of the mass texture discriminate best between malignant and benignant sinus tumor, therefore leads to an improvement of the diagnosis.
Scopul acestui articol este de a dezvolta algoritmi având ca punct de plecaremetode din teoria sistemelor dinamice haotice (analiza dimensiunii fractale) și metode statistice nonparametrice (bootstrap și determinarea intervalelor de încredere) și de a-i aplica la studiul imaginilor CT reprezentând tumori maligne sau benigne ale zonei para-sinusale. Studiul statistic a arătat că dimensiunea fractală a texturii discriminează mai bine între tumorile maligne și benigne, ducând astfel la îmbunătățirea posibilităților de diagnostic.
1. Introduction
Fractal analysis and nonlinear time series analysis are branches of chaos theory. They provide useful methods for the characterization of single and multi variable signals (images and time series).
Usually, fractal analysis refers to a collection of methods for the description and quantization of geometric features of irregular forms and patterns. It was largely applied for the study of biological systems and subsystems at microscopic and macroscopic scale, image enhancement and compression, fracture analysis, texture classification because of their fractal-like structure of themanipulated objects ([3], [7], [8]).Its most known measure is the fractal dimension used to provideinformation on the irregularity of an object contour or self similarities in a texture.
Fractal analysis was largely applied for distinction between normal and modified tissue and between benignant and malignant tissue ([3], [7][8]).
The case study considered in this paper targets the classification of masses into benignant and malignant. Benignant and malignant tumors of the paranasal sinuses may be asymptomatic for a long time and represents 3% of head and neck carcinomas ([6], [1]). When symptoms arise they often mimic the clinical picture of chronic rhinosinusitis, which is by far more frequent. For these reasons tumor diagnosis is often delayed ([9], [6]). As there is a myriad of different tumor entities, it may be beneficial for the clinician to distinguish between epithelial tumors (papilloma, pleomorphic adenoma), mesenchymal tumors (fibromatosis, osteoma), neural-related tumors (schwannoma) and tumor like lesions (giant cell
granuloma, mucocele) ([1]). Imaging is indicated whenever there is clinical suspicion for a neoplastic process. Computed tomography [CT] and magnetic resonance imaging [MRI] are complimentary in the pretreatment evaluation of patients with sinonasal tumors.
In this paper we present a study based on the fractal dimension of the analyzed masses formed in the paranasal sinuses region.
We consider a series (a number of 34) of CT images taken with contrast substance containing the tissue that has fractal – like structure. The 34 CT images consist in 17 malignant tumors and 17 benignant (two samples of same size).
Distinction between malignant and benignant masses is made by calculating:
1. the fractal dimension of the mass’s texture
2. the fractal dimension of the mass’s contour.
A nonparametric bootstrap analysis with a jackknife correction for errors ([5], [4]) is run to assess the accuracy of our primary statistical results. We applied this technique to obtain more reliable statistical estimators (mean, standard
deviation and confidence intervals for the mean) in order to make statistical inference, that is, to decide the power of discrimination between malignant and benignant masses, in both measurements (the fractal dimension of the mass’s texture and the fractal dimension of the mass’s contour).
We conclude that a more accurate discrimination is obtained when using the Fd of texture.
2. Methods
In the last 2 decades fractal analysis become a powerful tool for analyzing the form, pattern and growth in biological systems. This kind of details are captured, best, by using the fractal dimension (Fd) which provides us a measure of non/smoothness of a contour or a texture. The fractal dimension is calculated by applying the „box-counting” estimation algorithm because, in comparison to other methods, it offers two major advantages: it is easy to and can be applied for images no matter how complex.
The statistical inference is based on a nonparametric bootstrap technique.
The general bootstrap method introduced by Efron (1979) is a resampling procedure for estimating the distributions of statistics based on independent observations. The bootstrap method is shown to be successful in many situations, which is being accepted as an alternative to the asymptotic methods. In fact, it is better than some other asymptotic methods, such as the traditional normal approximation and the Edgeworth expansion ([2]). The nonparametric bootstrap is suitable when the population distribution function is completely unknown and when the sample size is small (less than 30).
Box-Counting Fractal Dimension Estimation Method
The ”box-counting” fractal dimension, derived from the Hausdorff coverage dimension is given by the following approximation:
![]() where: – N(s) is the number of squares that contain information when grid covers the image (parts of the extracted contour/texture)
where: – N(s) is the number of squares that contain information when grid covers the image (parts of the extracted contour/texture)
– s squares’ side length.
It is expected, that for a smaller s value, the above approximation should be better:
![]() If this limit exists, it is called the ”box-counting” dimension of the measured object. In practice, this limit converges slowly, that is why the following expression is used:
If this limit exists, it is called the ”box-counting” dimension of the measured object. In practice, this limit converges slowly, that is why the following expression is used:
![]() This is the equation of a straight line of slope Fd, the ”log-log” curve described by the points of (log(N(s), log(1/s)) for different values of the square’s side s.
This is the equation of a straight line of slope Fd, the ”log-log” curve described by the points of (log(N(s), log(1/s)) for different values of the square’s side s.
Through linear regression (least squares method) the slope of the line that approximates the points’ distribution is determined; this is the “box-counting” fractal dimension.
The „box-counting” algorithm assumes to determine the fractal dimension in accordance with the dependence of the object contour or texture upon the used scale factor.
It consists in :
1. to transform the grey shades CT image into a binary image by applying a certain threshold and all the pixels with grey levels over that threshold are made black and the rest white.
2. to cover successivly the image by applying grids of squares with equal sides s of dimensions powers of two: 2, 4, 8, … and counting every time the squares that contain at least one black pixel – some part of the analyzed object (N(s)).
3. the points of coordinates (log(N(s)), log(1/s)), where s is the common side of the coverage squares, and N(s) the number of squares that contain information, are positioned approximately in a line and its slope will be the fractal dimension in “box-counting” context/perspective.
We’ll apply the “box-counting” algorithm, described above, for different scale values s, using software – MorfoFractal, a graphical application developed by the authors.
We have used images that contain those parts of the masses that are not obstructed by nearby bones, such that we can obtain information on the free evolution of the mass.
The “box-counting” fractal dimension is estimated for:
1. the masses (tumors) textures and
2. the masses (tumors) contours.
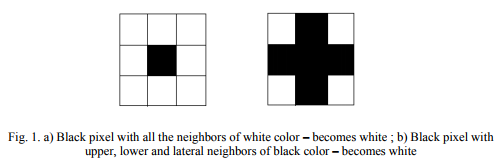
In the second case, the contour of the mass is extracted by using following procedure:
– search for all the pixels that are black and are not part of the object, their neighbors are all white (or, in some cases, have a limited number of black neighbors – one or two) and make them white.
– search for all the pixels that are black and have the upper, lower, right and left neighbors black and make them white. (Fig.1).
By employing this procedure we will obtain the interconnected pixels in the image that delimitate the object from the background.
Statistical Methods
A traditional approach to statistical inference is to make assumptions about the structure of the population (e.g., an assumption of normality), and, along with the stipulation of random sampling, to use these assumptions to derive the sampling distribution, on which classical inference is based. This familiar approach has two potentially important deficiencies: if the assumptions about the population are wrong, then the corresponding sampling distribution of the statistic may be seriously inaccurate. On the other hand, if asymptotic results are relied upon, these may not hold to the required level of accuracy in a relatively small sample.
In contrast, the nonparametric bootstrap allows us to estimate the sampling distribution of a statistic empirically without making assumptions about the form of the population, and without deriving the sampling distribution explicitly.
The general nonparametric bootstrap procedure is based on five steps as follows (refer to Efron and Tibshirani [5] for detailed discussions):
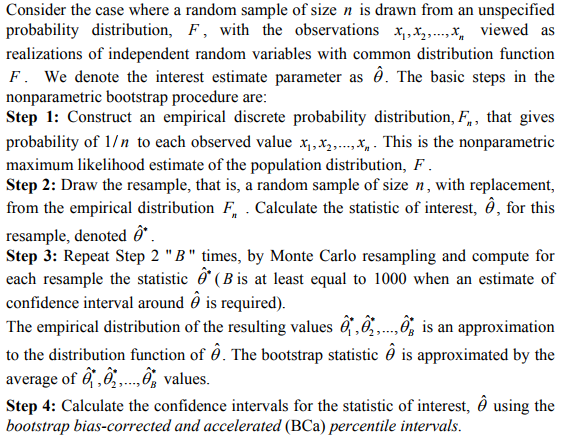
There are several approaches to constructing bootstrap confidence intervals. One of the most widely used is the bootstrap percentile interval: the endpoints of a
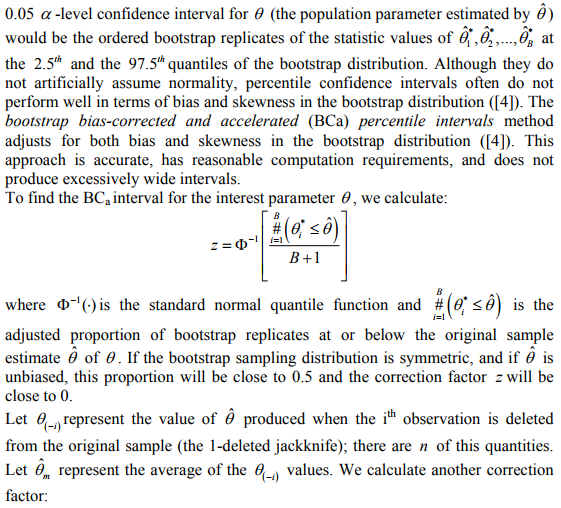
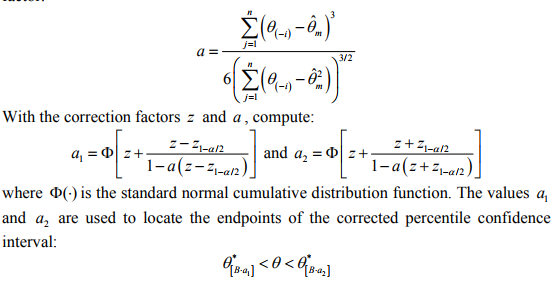

corresponds to the (uncorrected) percentile interval.
The above algorithm and the random generator of the bootstrap samples was implemented as a MatLab routine. The bootstrap analysis was conducted for B = 2000 , for both samples of n =17 and in each sample, for both types of measurements (the fractal dimension of the mass’s texture and the fractal dimension of the mass’s contour). In each of the four resulted data sets, the statistics of interest were the mean and standard deviation. The confidence interval was calculated for the mean with the BCa method.
3. Results
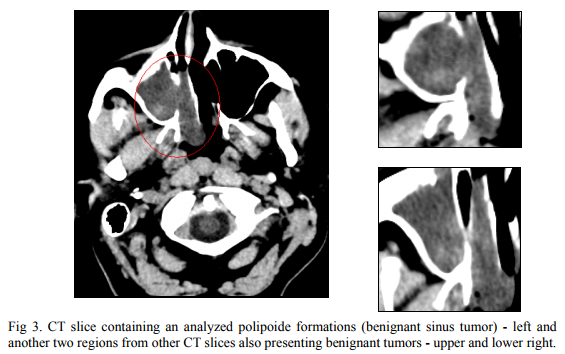
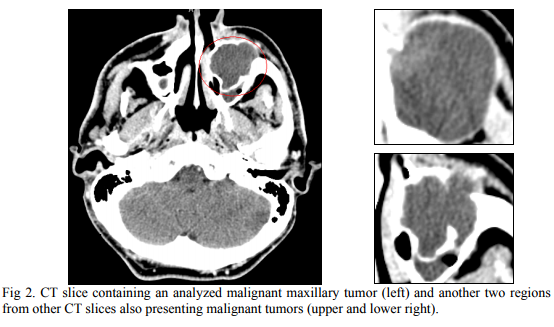
Two sets of CT images representing sinus tumors are analyzed: 17 malignant (Fig.2) and 17 benignant (Fig.3). The fractal dimension values of the contours and textures of all this images were estimated using the procedures described in Chapter 2. Some results are displayed in Table 1.

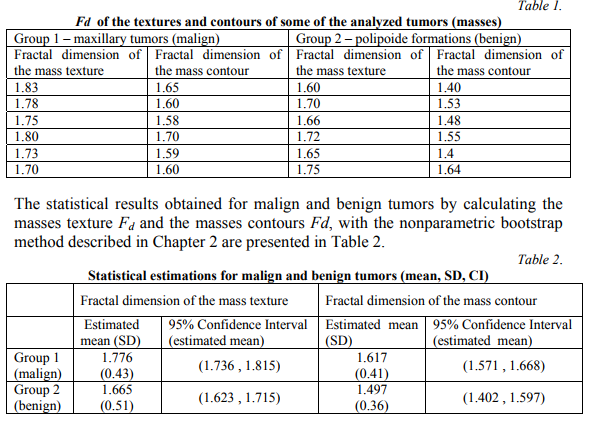
The values obtained for the estimated mean of mass texture and contour discriminate both between the malign and benign groups (Kolmogorov-Smirnov test, p=0.016, respective p=0.025). Because of the overlapping 95% confidence interval in the case of fractal dimension of the mass contour (values between 1.571 and 1.597 can be misclassified), we conclude that the fractal dimension of
the mass texture is a more accurate discrimination measurement between benignant and malignant masses formed in the paranasal sinuses region.
4. Conclusions
Because of the asymptomatic or confounding symptoms of the paranasal sinuses tumors, any improvement in early diagnosis is beneficial for the rhinologist practician. The goals of patient evaluation for suspected sinonasal cancers include a precise diagnosis, determining the extend of disease and developing a treatment plan. The two powerful algorithms involved in the study – the box-counting and the nonparametric bootstrap with BCa revealed that omputing the fractal dimension of the mass texture is an accurate and valuable method for a precise diagnosis. The Fd for masses texture leads to a better statistical discrimination because it takes into consideration all the details of the analyzed image sections.
By improving the CT noninvasive diagnosis methods, the presence of a sinonasal tumor can be more accurate predicted, leading to a mor efficient medical evaluation and treatment.
REFERENCES
[1] I. Anghel, A. Anghel, (2011). “Inverted papilloma”, Practica Medicală, Bucharest,vol 6, nr.1:p.30-35;
[2] A.C.Davison, D.V. Hinkley, (1997). “Bootstrap Methods and their Application”. Cambridge: Cambridge University Press.
[3] R.Dobrescu, C. Vasilescu (2004). “Interdisciplinary Applications Of Fractal And Chaos Theory”, Academia Română, Bucuresti,
[4] B. Efron, , (1987). “Better Bootstrap Confidence Intervals”. Journal of the American Statistical Association 82 (397): 171–185.
[5] B. Efron, , R.J. Tibshirani, (1993). “An introduction to the bootstrap”. Chapman and Hall, London.
[6] G. Galzada, R. Weber, (2009). “Malignant Tumors of the Nose and Paranasal Cavity”, Rhinology and Facial and Plastic Surgery, Springer: p.388-394;
[7] G. Landini (1998). „Complexity in tumor growth patterns” in Fractals in Biology and Medicine, ed. G.A. Losa, Birkhauser Verlag : p.268-284
[8] M. Olteanu, A. Udrea, (2010). “Image Analysis based on the study of the attractor of a time series”, U.P.B. Sci. Bull. Series A, Vol. 72, Iss. 4, ISSN 1223-7027 p.11-18
[9] B.Schik, J. Dlugaiczyk, (2009). “Benign Tumors of the Nasal Cavity and Paranasal Sinuses”, Rhinology and Facial Plastic Surgery, Springer: p.378-385.